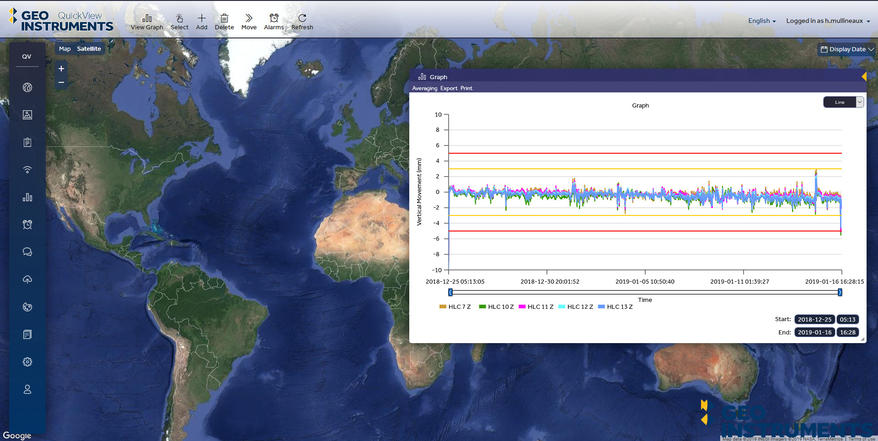
Powerful, adaptable and easy to use, QuickView is a browser-based data visualisation platform at the centre of your monitoring project.

Common uses
Process
Ideal for the collection and display of all your project’s information, QuickView is not just for Instrumentation and Monitoring data.
Weather data, plant telemetry, excavation/construction progress, site logs and many other types of information can all be archived and visualised on your project’s individual QuickView page.
With a focus on convenience and functionality QuickView is browser-based and optimised for mobile devices, making data accessible at a moment’s notice. QuickView has a wealth of visualisation options from full site overviews, customisable views, models, graphs and tables. Recorded data can be uploaded automatically or manually from any browser. Users can download data, export graphs and generate reports.
The platform allows the client to review historical data and use the journal feature to keep detailed records of key events through the progress of works. Sophisticated alarm/trigger systems can be user defined and adjusted at will, allowing for complete control over exceedance limits, timings and alert recipients. QuickView is designed to be intuitive and easy to learn, quickly allowing users to analyse, report and discuss monitoring results.
